
Note
Go to the end to download the full example code or to run this example in your browser via Binder.
Stress tensor#
Optical forces on bulk and thin layers of dielectric and metal.
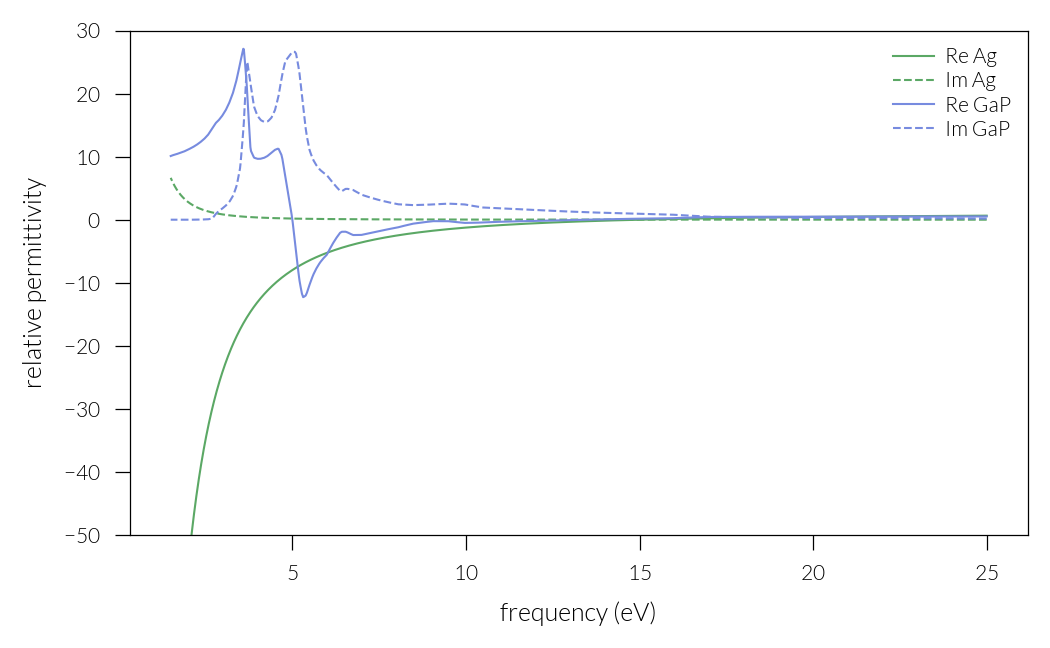
Results are compared to the reference [Antonoyiannakis1999]. First we define the material dielectric functions
plt.close("all")
plt.ion()


nwl = 81
wl, n = np.loadtxt("GaP_Aspnes.csv", skiprows=1, delimiter=",", max_rows=nwl - 1).T
wl1, k = np.loadtxt(
    "GaP_Aspnes.csv", skiprows=nwl + 2, delimiter=",", max_rows=nwl - 1
).T
assert np.all(wl1 == wl)


def epsilon_GaP(wli):
    return (np.interp(wli, wl, n) + 1j * np.interp(wli, wl, k)) ** 2


def epsilon_Al(wli):
    f = h * c / e / wli * 1e6
    f_p = 15
    gamma = 0.1
    return 1 - f_p**2 / (f * (f + 1j * gamma))


wls = np.linspace(wl[0], wl[-1], 500)
eps_Al = epsilon_Al(wls)
eps_GaP = epsilon_GaP(wls)
fs = h * c / e / wls * 1e6

plt.figure()
plt.plot(fs, eps_Al.real, label="Re Ag", c="#5ba865")
plt.plot(fs, eps_Al.imag, "--", label="Im Ag", c="#5ba865")
plt.plot(fs, eps_GaP.real, label="Re GaP", c="#778bdf")
plt.plot(fs, eps_GaP.imag, "--", label="Im GaP", c="#778bdf")
plt.ylim(-50, 30)
plt.xlabel("frequency (eV)")
plt.ylabel("relative permittivity")
plt.legend()
plt.tight_layout()
Define the simulation
lattice = nn.Lattice(([1.0, 0], [0, 1.0]))
sup = lattice.Layer("Superstrate", epsilon=1)
freqs = np.linspace(1, 25, 500)


def simulation(mat, slab_flag=False):
    ref = []
    trans = []
    pressure = []
    for f in freqs:
        w = h * c / e / f * 1e6
        pw = nn.PlaneWave(wavelength=w, angles=(0, 0, 0))
        eps_sub = epsilon_GaP(w) if mat == "GaP" else epsilon_Al(w)
        if slab_flag:
            sub = lattice.Layer("Substrate", epsilon=1)
            slab = lattice.Layer("Slab", epsilon=eps_sub, thickness=0.4)
            stack = [sup, slab, sub]
        else:
            sub = lattice.Layer("Substrate", epsilon=eps_sub)
            stack = [sup, sub]
        sim = nn.Simulation(stack, pw, 1)
        R, T = sim.diffraction_efficiencies()
        Tx1, Ty1, Tz1 = sim.get_z_stress_tensor_integral("Superstrate")
        if slab_flag:
            Tx3, Ty3, Tz3 = sim.get_z_stress_tensor_integral("Slab")
            Tz1 -= Tz3
        # Tz -= Tz1
        ref.append(R)
        trans.append(T)
        pressure.append(-Tz1)

    return ref, trans, pressure
Do the calculation
ref_Al_slab, trans_Al_slab, pressure_Al_slab = simulation("Al", slab_flag=True)
ref_GaP, trans_GaP, pressure_GaP = simulation("GaP", slab_flag=False)
ref_Al, trans_Al, pressure_Al = simulation("Al", slab_flag=False)
Figure 3
plt.figure()
plt.plot(freqs, ref_Al, label="$r$ (Al, bulk)", lw=1, c="#bbdf77")
plt.plot(freqs, ref_GaP, label="$r$ (GaP, bulk)", lw=1, c="#77addf")
plt.plot(freqs, ref_Al_slab, "--", label="$r$ (Al, 400nm)", c="#635a5e")
plt.plot(freqs, trans_Al_slab, "--", label="$t$ (Al, 400nm)", c="#e77d7d")
plt.xlabel("frequency (eV)")
plt.ylabel("Intensity")
plt.legend()
plt.tight_layout()
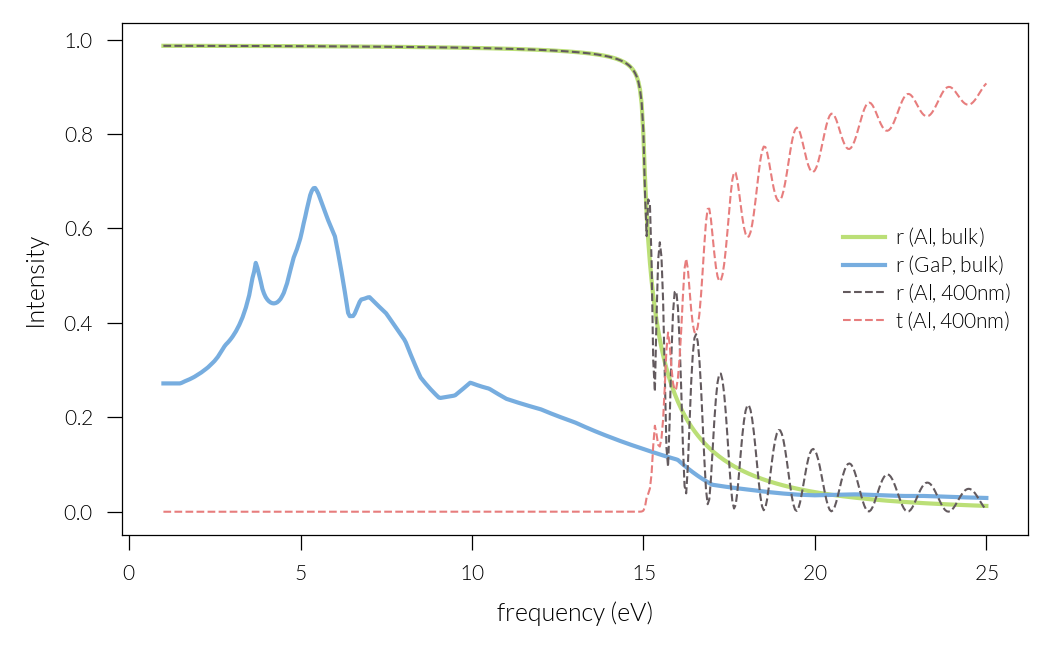
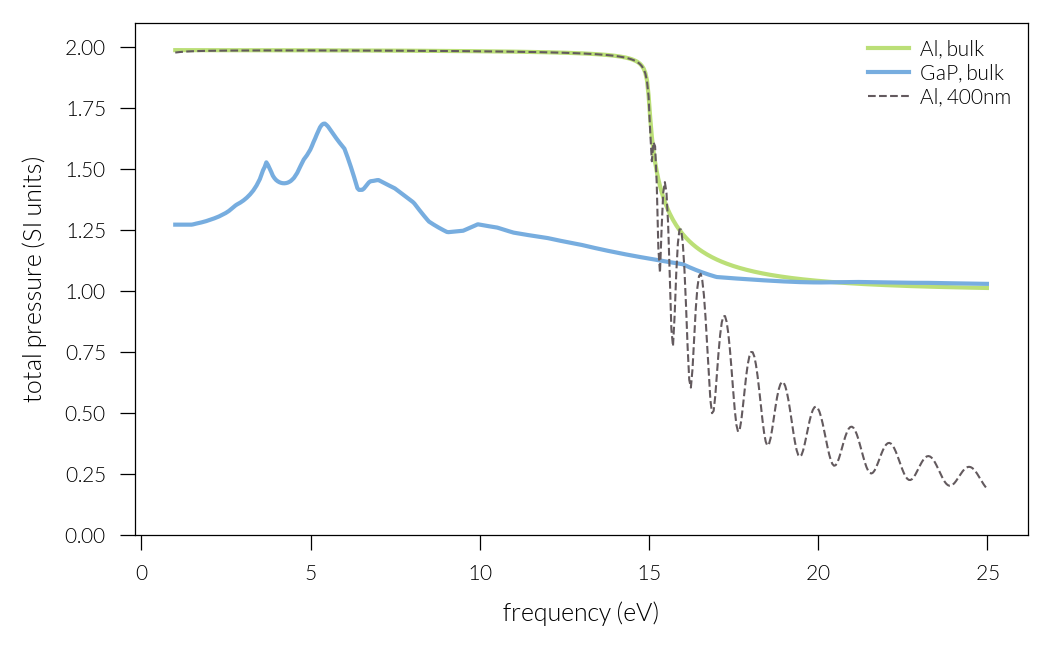
Figure 4
plt.figure()
plt.plot(freqs, pressure_Al, label="Al, bulk", lw=1, c="#bbdf77")
plt.plot(freqs, pressure_GaP, label="GaP, bulk", lw=1, c="#77addf")
plt.plot(freqs, pressure_Al_slab, "--", label="Al, 400nm", c="#635a5e")
plt.xlabel("frequency (eV)")
plt.ylabel("total pressure (SI units)")
plt.ylim(0, 2.1)
plt.tight_layout()
plt.legend()
plt.show()
Define the simulation
def simulation_angle(eps_sup, eps_sub, angle):
    lattice = nn.Lattice(([1.0, 0], [0, 1.0]))
    sup = lattice.Layer("Superstrate", epsilon=eps_sup)
    slab = lattice.Layer("Slab", epsilon=1, thickness=1)
    sub = lattice.Layer("Substrate", epsilon=eps_sub)
    pressure = []
    for theta in angle:
        pw = nn.PlaneWave(wavelength=1 / 0.01, angles=(theta, 0, 90))
        sim = nn.Simulation([sup, slab, sub], pw, 1)
        sim.solve()
        T1x, T1y, T1z = sim.get_z_stress_tensor_integral("Slab")
        pressure.append(-T1z)
    return np.array(pressure)
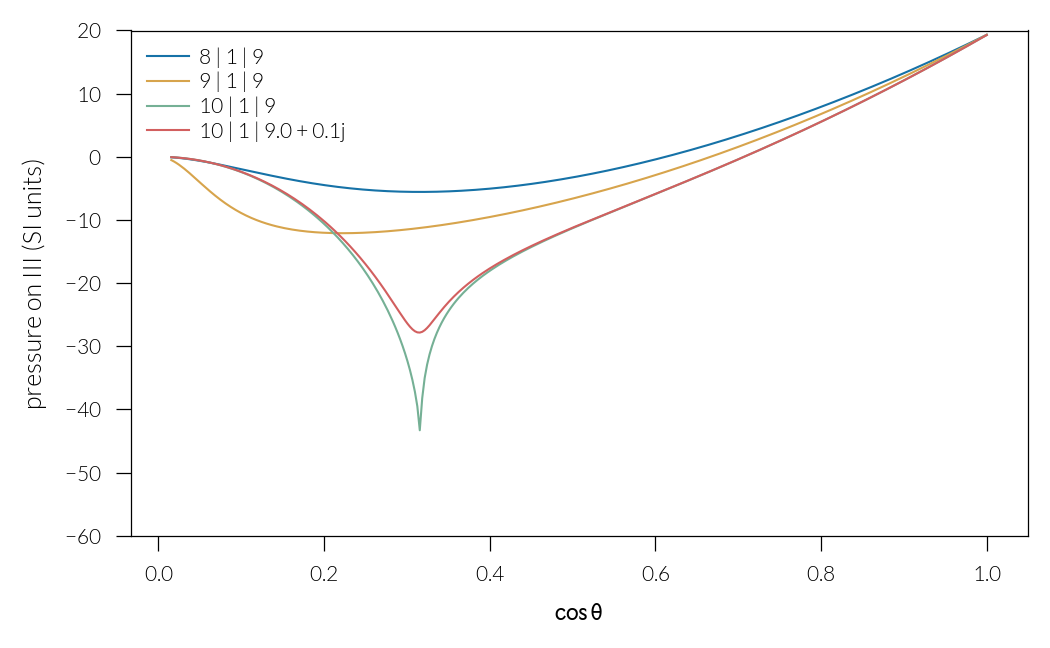
Figure 6
angle = np.linspace(0, 90 * 0.99, 500)

plt.figure()
for eps_sup, eps_sub in zip([8, 9, 10, 10], [9, 9, 9, 9 + 0.1j]):
    pressure = (
        simulation_angle(eps_sup, eps_sub, angle) * 3.5e9 / (c / eps_sup.real**0.5)
    )
    if np.imag(eps_sub) == 0:
        label = f"{eps_sup} | 1 | {eps_sub}"
    else:
        label = f"{eps_sup} | 1 | {eps_sub.real} + {eps_sub.imag}j"
    plt.plot(np.cos(angle * nn.pi / 180), pressure, label=label)

plt.ylim(-60, 20)
plt.legend()
plt.xlabel(r"$\cos{\theta}$")
plt.ylabel("pressure on III (SI units)")
plt.tight_layout()
Total running time of the script: (0 minutes 24.040 seconds)
Estimated memory usage: 642 MB