Note
Go to the end to download the full example code. or to run this example in your browser via Binder
Backends comparison#
Numerical backends performace comparison.
import matplotlib.pyplot as plt
import numpy as np

markers = ["o", "s", "d", "v", "^", ">"]
figsize = (2, 2)
threads = [1, 2, 4, 8, 16]
devices = ["cpu", "gpu"]
# backends = ["numpy", "scipy", "autograd", "jax", "torch"]
# we skip jax as it is complicated to deal with multithreading so a fair comparison is impossible
backends = ["numpy", "scipy", "autograd", "torch"]

colors = ["#3b9dd4", "#ecd142", "#e87c40", "#b33dd1", "#50ba61", "#cd2323"]
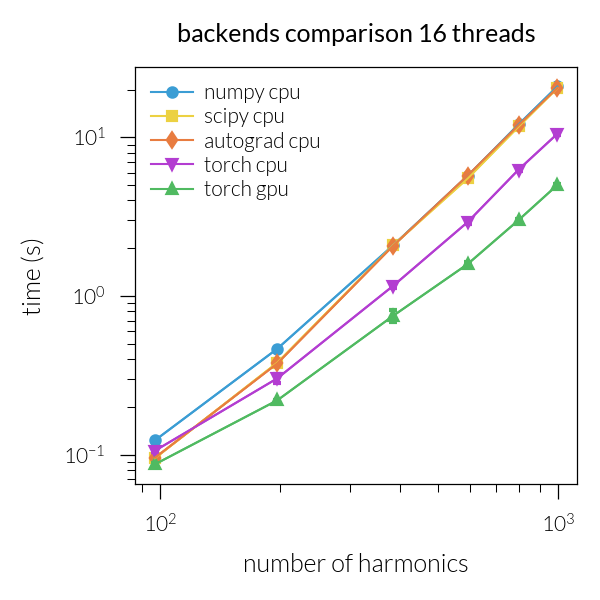
Time vs. number of harmonics#
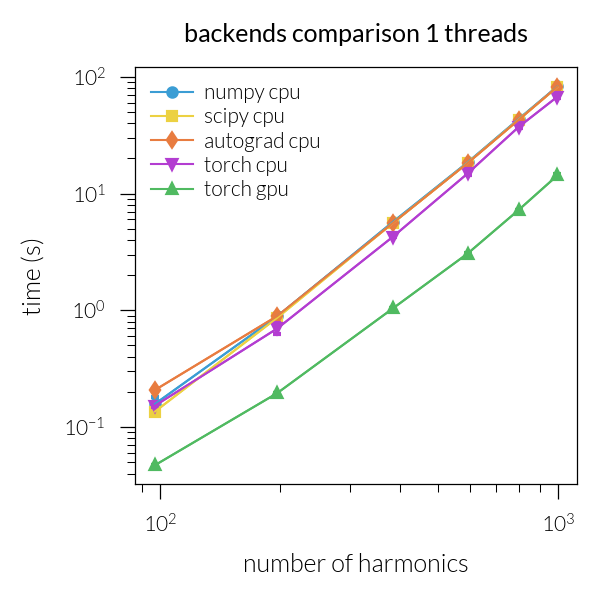
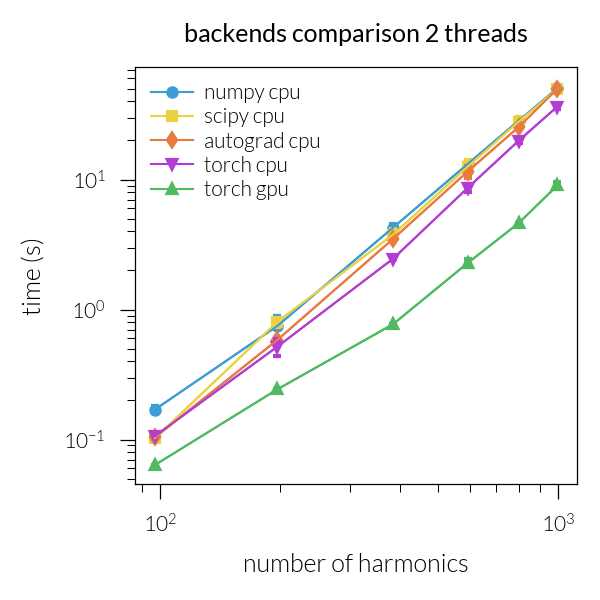
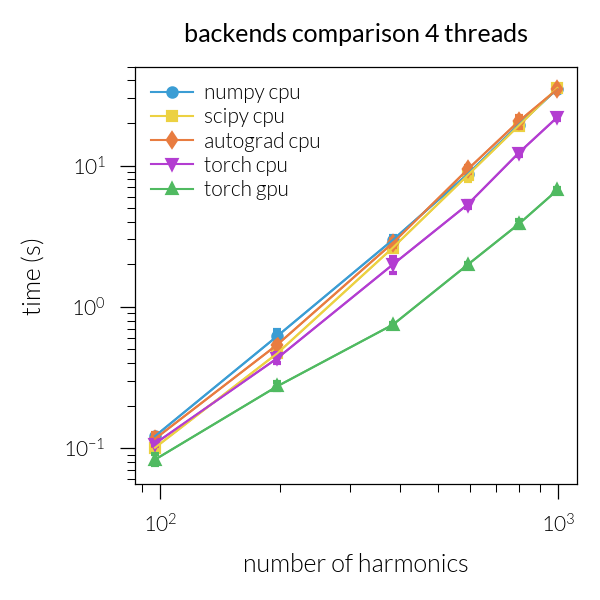
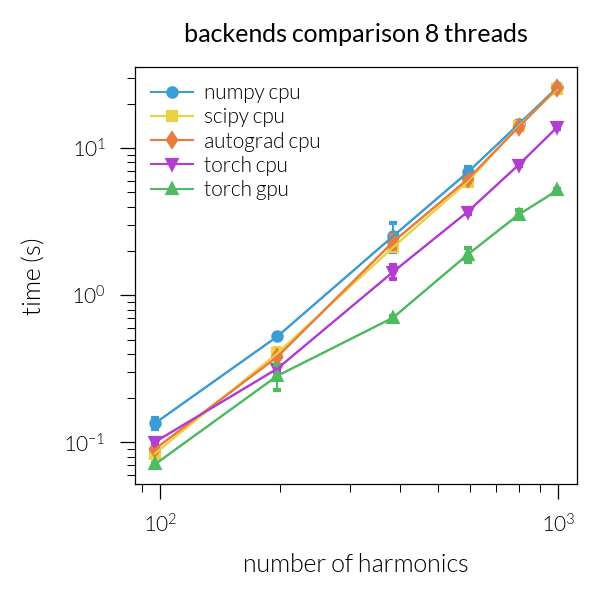
for num_threads in threads:
    plt.figure(figsize=figsize)
    i = 0
    for backend in backends:
        for device in devices:
            g = "cuda" if device == "gpu" else device
            if device != "gpu" or backend not in [
                "numpy",
                "scipy",
                "autograd",
                "jax",
            ]:
                arch = np.load(
                    f"{num_threads}/benchmark_{backend}_{g}.npz", allow_pickle=True
                )
                NH = arch["real_nh"]
                plt.plot(
                    arch["real_nh"],
                    arch["times"],
                    f"-{markers[i]}",
                    c=colors[i],
                    label=f"{backend} {device}",
                )

                times_all = np.array(arch["times_all"])
                times_std = np.std(times_all, axis=1)
                plt.errorbar(
                    arch["real_nh"],
                    arch["times"],
                    times_std,
                    c=colors[i],
                    capsize=1,
                )

                i += 1
    plt.legend()
    plt.yscale("log")
    plt.xscale("log")
    plt.xlabel("number of harmonics")
    plt.ylabel("time (s)")
    plt.title(f"backends comparison {num_threads} threads")
    plt.tight_layout()
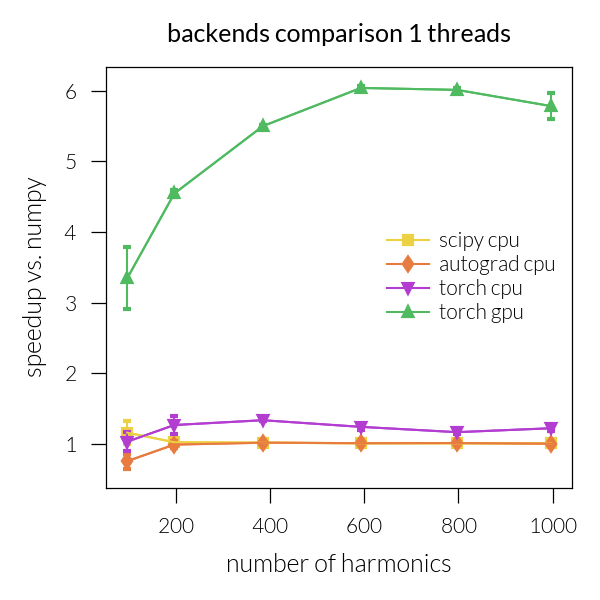
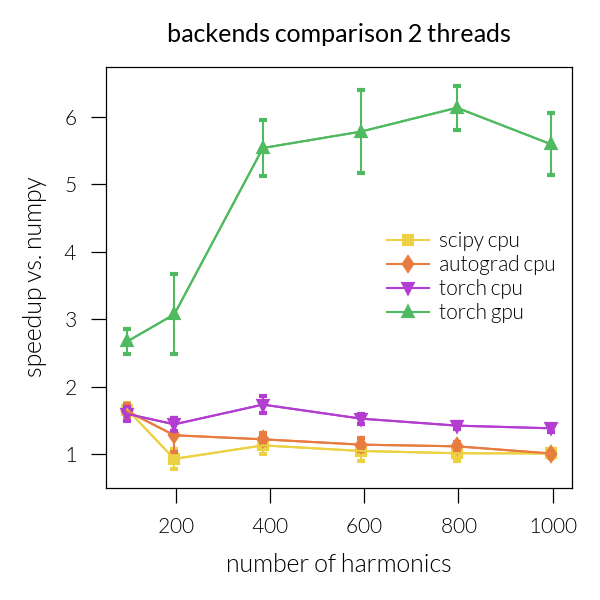
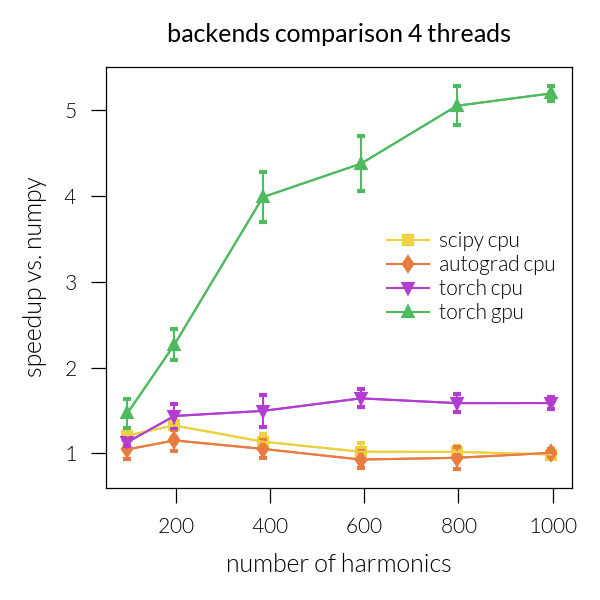
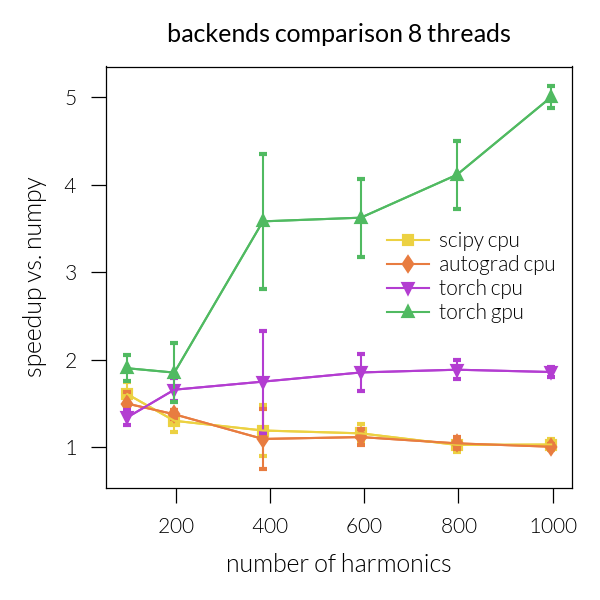
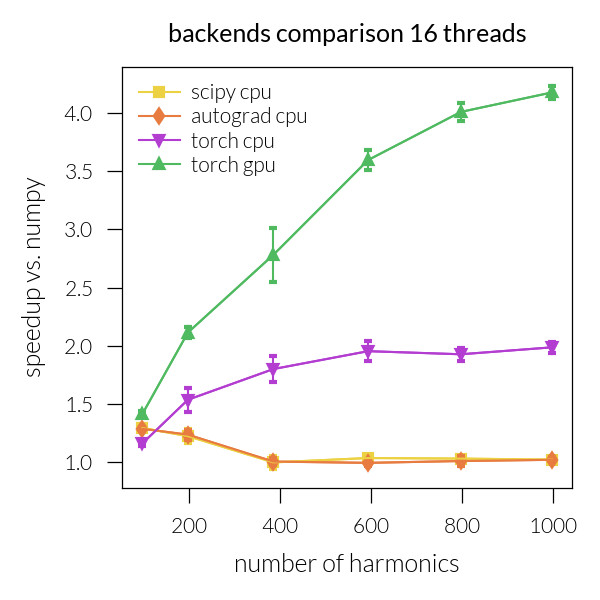
Speedup vs. number of harmonics#
for num_threads in threads:
    plt.figure(figsize=figsize)
    arch_np = np.load(f"{num_threads}/benchmark_numpy_cpu.npz", allow_pickle=True)

    i = 1
    for backend in backends:
        for device in devices:
            g = "cuda" if device == "gpu" else device
            if device != "gpu" or backend == "torch":
                arch = np.load(
                    f"{num_threads}/benchmark_{backend}_{g}.npz", allow_pickle=True
                )
                if backend != "numpy":
                    speedup = np.array(arch_np["times"]) / np.array(arch["times"])
                    plt.plot(
                        arch["real_nh"],
                        speedup,
                        f"-{markers[i]}",
                        c=colors[i],
                        label=f"{backend} {device}",
                    )

                    speedup_all = np.array(arch_np["times_all"]) / np.array(
                        arch["times_all"]
                    )
                    speedup_std = np.std(speedup_all, axis=1)
                    plt.errorbar(
                        arch["real_nh"],
                        speedup,
                        speedup_std,
                        c=colors[i],
                        capsize=1,
                    )
                    i += 1
    plt.legend()
    # plt.yscale("log")
    # plt.xscale("log")
    plt.xlabel("number of harmonics")
    plt.ylabel("speedup vs. numpy")
    plt.title(f"backends comparison {num_threads} threads")
    plt.tight_layout()
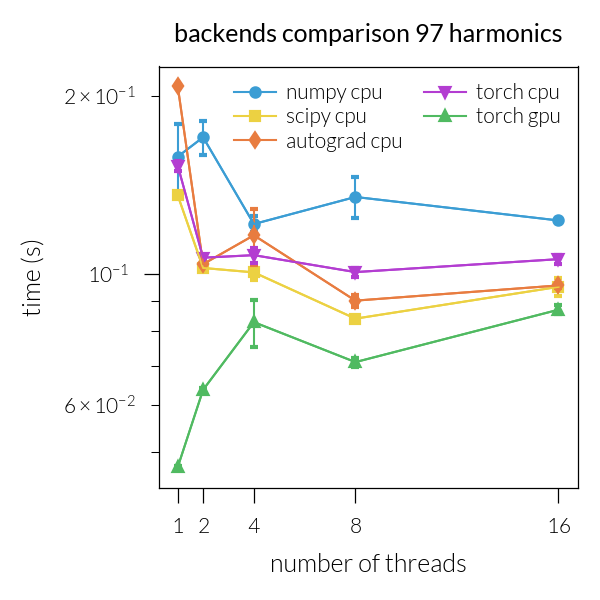
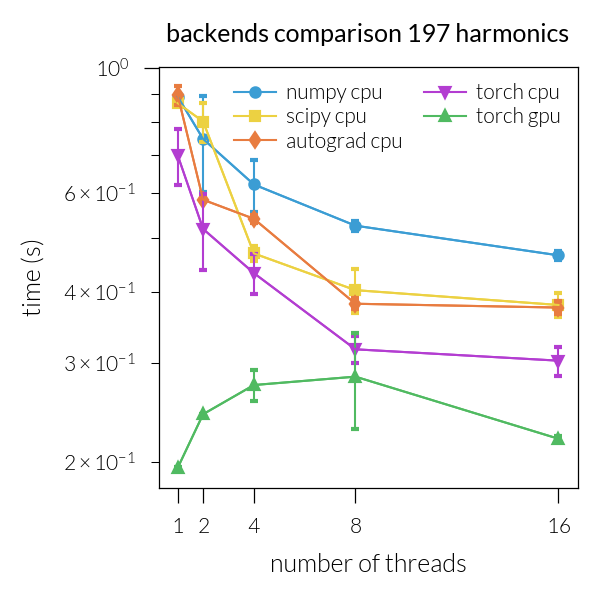
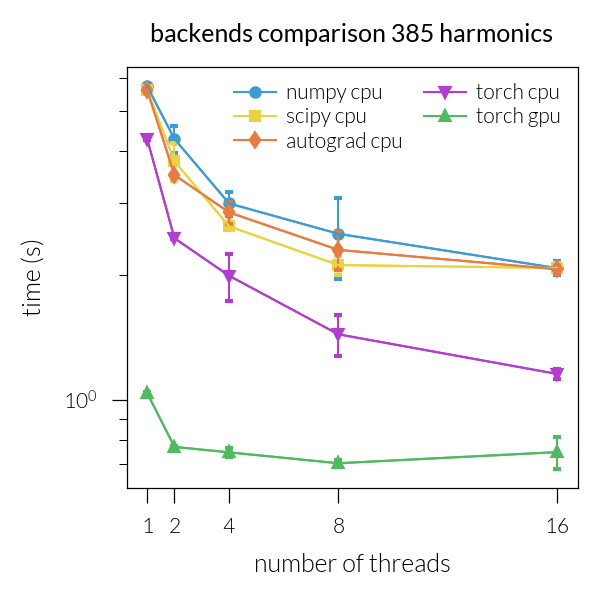
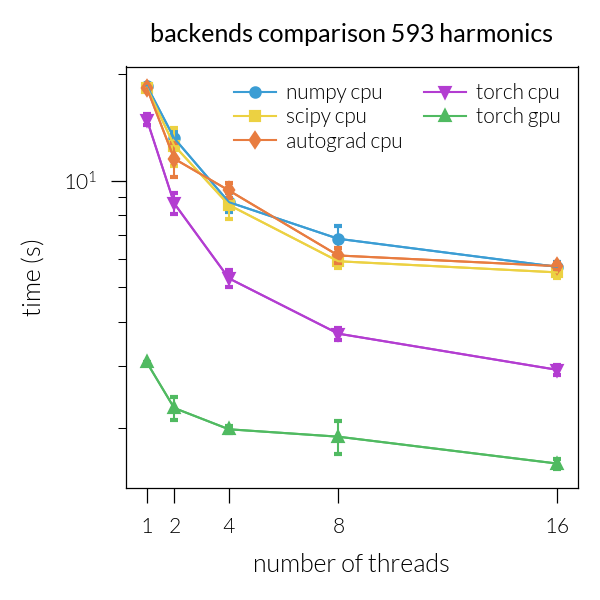
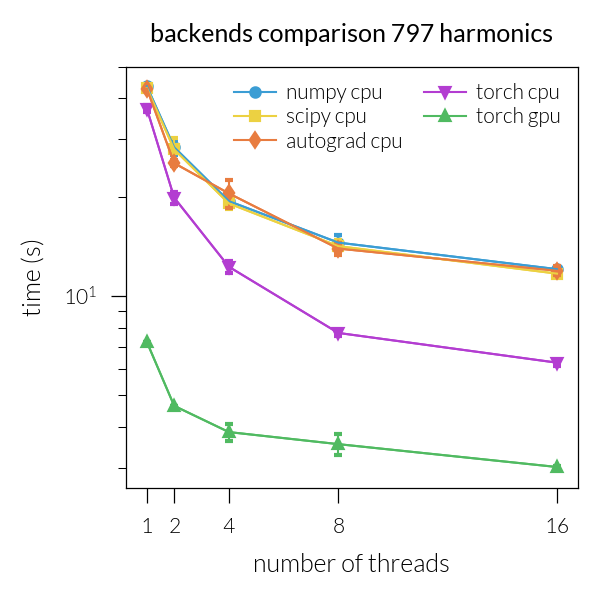
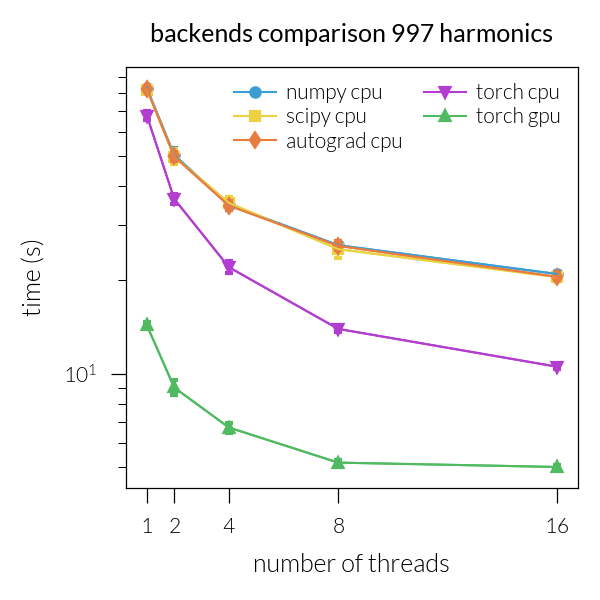
Time vs. number of threads#
for inh in range(len(NH)):
    plt.figure(figsize=figsize)
    i = 0
    for backend in backends:
        for device in devices:
            t_threads = []
            t_threads_all = []
            for num_threads in threads:
                if device != "gpu" or backend == "torch":
                    g = "cuda" if device == "gpu" else device
                    arch = np.load(
                        f"{num_threads}/benchmark_{backend}_{g}.npz", allow_pickle=True
                    )
                    t = arch["times"]
                    # t = np.array(t)
                    t_threads.append(t)
                    t_threads_all.append(arch["times_all"])
            if t_threads != []:
                t_threads = np.array(t_threads)
                plt.plot(
                    threads,
                    t_threads[:, inh],
                    f"-{markers[i]}",
                    c=colors[i],
                    label=f"{backend} {device}",
                )
                times_all = np.array(t_threads_all)[:, inh]
                times_std = np.std(times_all, axis=1)
                plt.errorbar(
                    threads,
                    t_threads[:, inh],
                    times_std,
                    c=colors[i],
                    capsize=1,
                )
                i += 1
    plt.xticks(threads)

    plt.legend(ncol=2)
    plt.yscale("log")
    # plt.xscale("log")
    plt.xlabel("number of threads")
    plt.ylabel("time (s)")
    plt.title(f"backends comparison {NH[inh]} harmonics")
    plt.tight_layout()
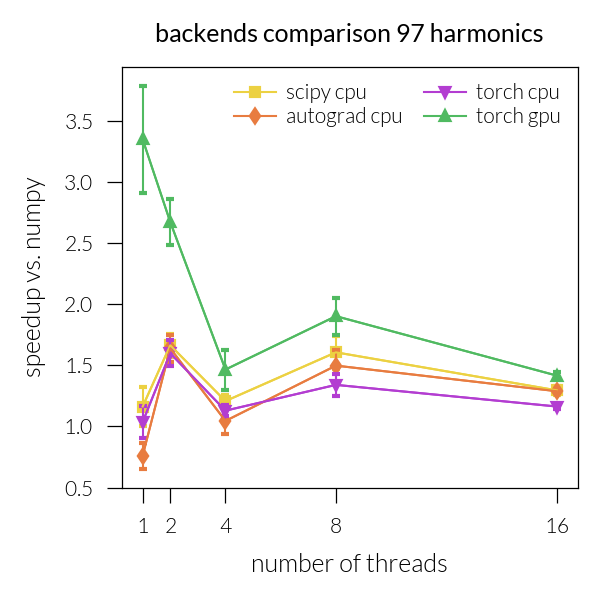
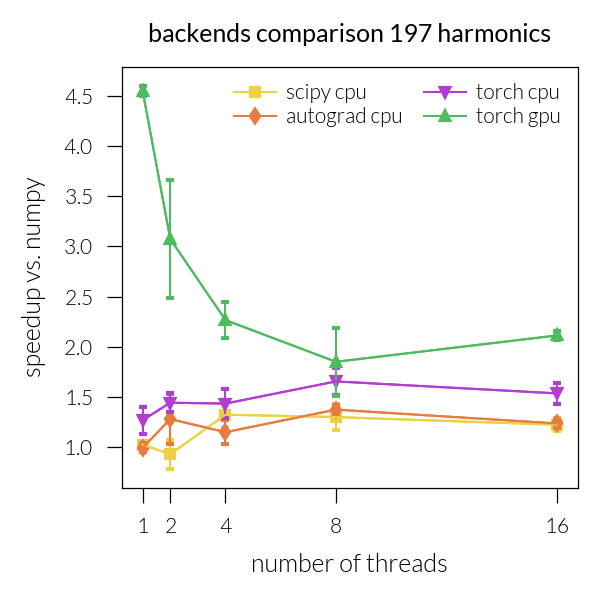
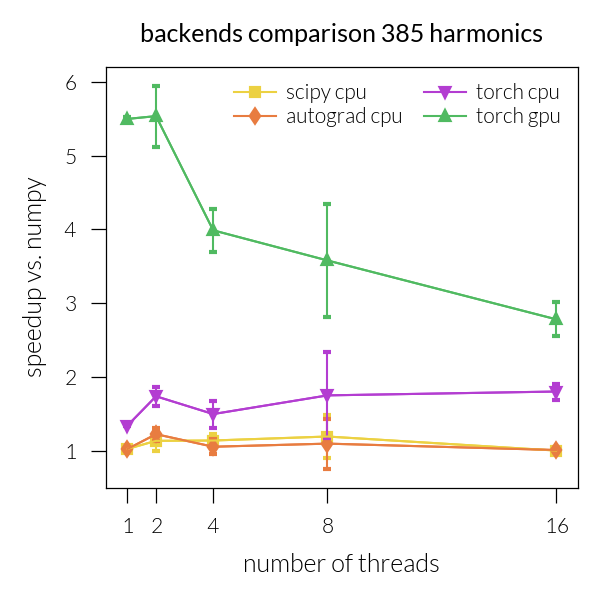
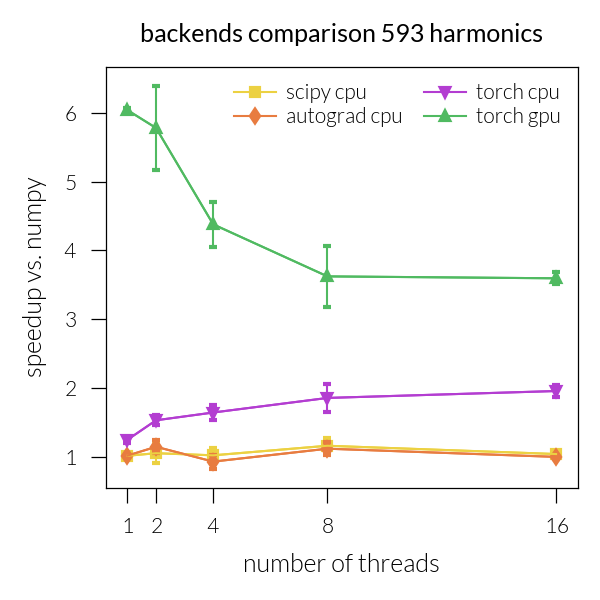
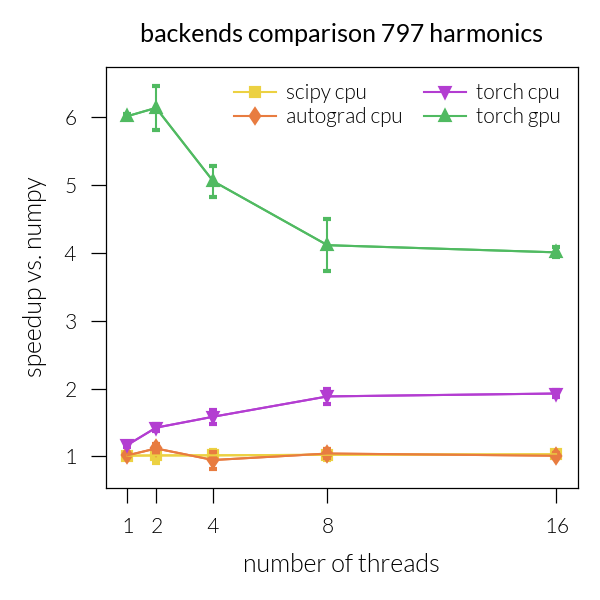
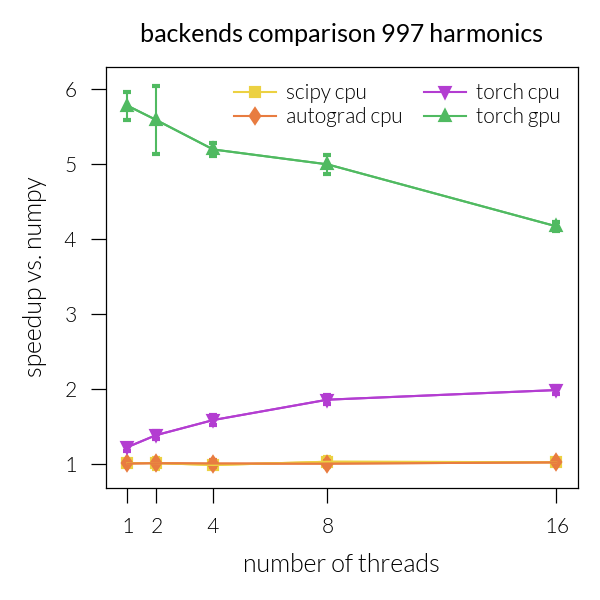
Speedup vs. number of threads#
for inh in range(len(NH)):
    plt.figure(figsize=figsize)
    i = 1
    for backend in backends:
        for device in devices:
            speedup_threads = []
            speedup_threads_all = []
            for num_threads in threads:
                if device != "gpu" or backend == "torch":
                    g = "cuda" if device == "gpu" else device
                    arch = np.load(
                        f"{num_threads}/benchmark_{backend}_{g}.npz", allow_pickle=True
                    )

                    arch_np = np.load(
                        f"{num_threads}/benchmark_numpy_cpu.npz", allow_pickle=True
                    )
                    if backend != "numpy":
                        t = arch["times"]
                        speedup = np.array(arch_np["times"]) / np.array(arch["times"])
                        speedup_threads.append(speedup)
                        speedup_all = np.array(arch_np["times_all"]) / np.array(
                            arch["times_all"]
                        )
                        speedup_threads_all.append(speedup_all)
            if speedup_threads != []:
                speedup_threads = np.array(speedup_threads)
                if backend != "numpy":
                    plt.plot(
                        threads,
                        speedup_threads[:, inh],
                        f"-{markers[i]}",
                        c=colors[i],
                        label=f"{backend} {device}",
                    )

                    speedup_std = np.std(np.array(speedup_threads_all)[:, inh], axis=1)
                    plt.errorbar(
                        threads,
                        speedup_threads[:, inh],
                        speedup_std,
                        c=colors[i],
                        capsize=1,
                    )
                    i += 1
    plt.xticks(threads)
    # plt.ylim(0.25, 3.8)

    plt.legend(ncol=2)
    # plt.yscale("log")
    # plt.xscale("log")
    plt.xlabel("number of threads")
    plt.ylabel("speedup vs. numpy")
    plt.title(f"backends comparison {NH[inh]} harmonics")
    plt.tight_layout()
Total running time of the script: (0 minutes 5.549 seconds)
Estimated memory usage: 523 MB

