
Note
Go to the end to download the full example code or to run this example in your browser via Binder.
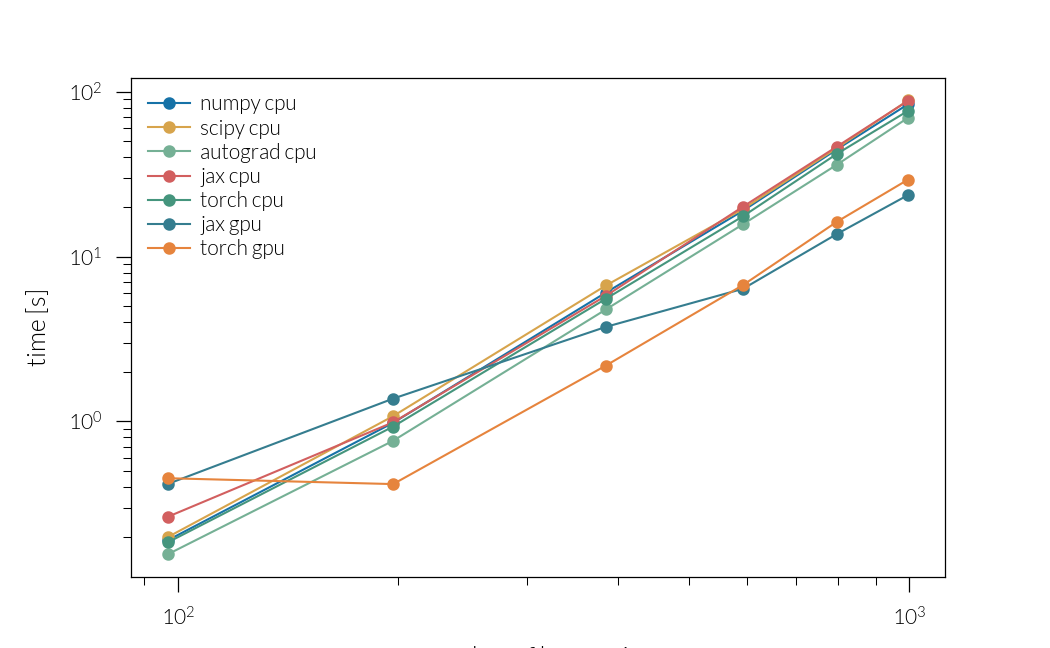
Benchmark#
Numerical backends performace comparison, with GPU acceleration, as run on Modal (https://modal.com)
import os

import matplotlib.pyplot as plt
import numpy as np

colors = plt.rcParams["axes.prop_cycle"].by_key()["color"]
colors = colors[:5] + colors[:5][-2:]


backends = ["numpy", "scipy", "autograd", "jax", "torch"]
inputs = [(b, "cpu") for b in backends]
inputs += [(b, "gpu") for b in ["jax", "torch"]]

markers = ["o", "s", "x", "^", "p", "^", "p"]
Plot timings
t = []

plt.figure()

for j, i in enumerate(inputs):
    backend, device = i
    fname = f"modal/benchmark_{backend}_{device}.npz"
    arch = np.load(fname)
    times = arch["times"]
    times_all = arch["times_all"]
    real_nh = arch["real_nh"]
    nh = arch["nh"]

    t.append(times_all)
    ls = "--" if device == "gpu" else "-"
    marker = markers[j]
    color = colors[j]

    plt.plot(
        real_nh, times_all, c=color, ls=ls, marker=marker, label=f"{backend} {device}"
    )
plt.legend()
plt.xlabel("number of harmonics")
plt.ylabel("time [s]")
plt.xscale("log")
plt.yscale("log")
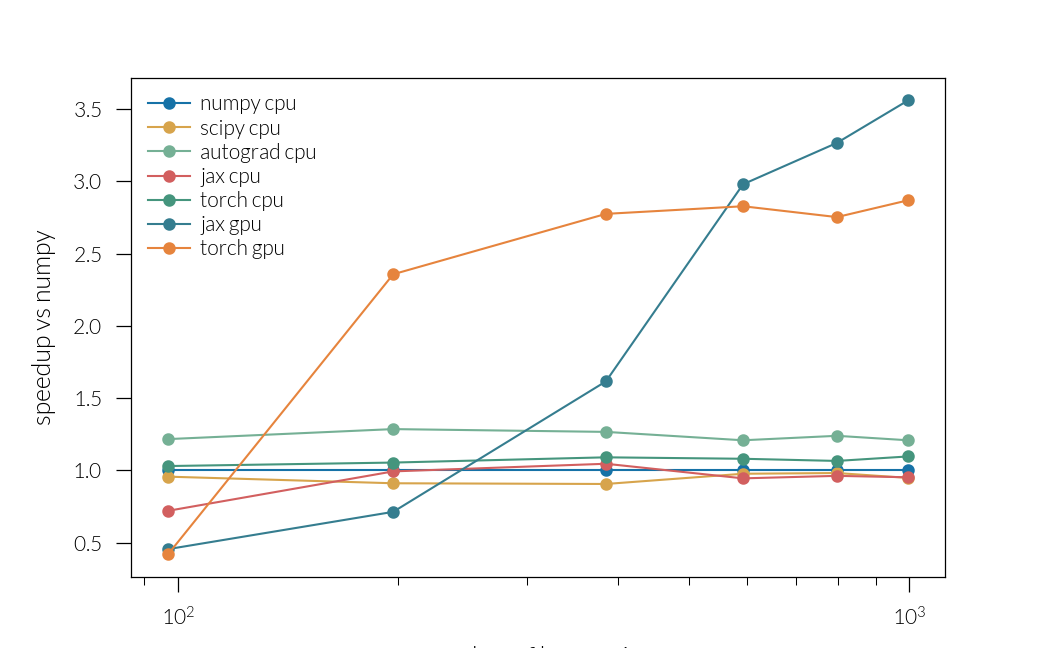
Plot speedup
plt.figure()
for j, i in enumerate(inputs):
    backend, device = i
    ls = "--" if device == "gpu" else "-"
    marker = markers[j]
    color = colors[j]
    plt.plot(
        real_nh, t[0] / t[j], c=color, ls=ls, marker=marker, label=f"{backend} {device}"
    )
plt.legend()
plt.xlabel("number of harmonics")
plt.ylabel("speedup vs numpy")
plt.xscale("log")
Total running time of the script: (0 minutes 10.668 seconds)
Estimated memory usage: 642 MB