
Note
Go to the end to download the full example code or to run this example in your browser via Binder.
Geometry tools#
Defining patterns using shapely, or built in functions.
import matplotlib.pyplot as plt
import numpy as np
import shapely.geometry as sg

import nannos as nn

N = 2**10
lattice = nn.Lattice([[1, 0], [0, 1]], N)
epsilon = lattice.ones()
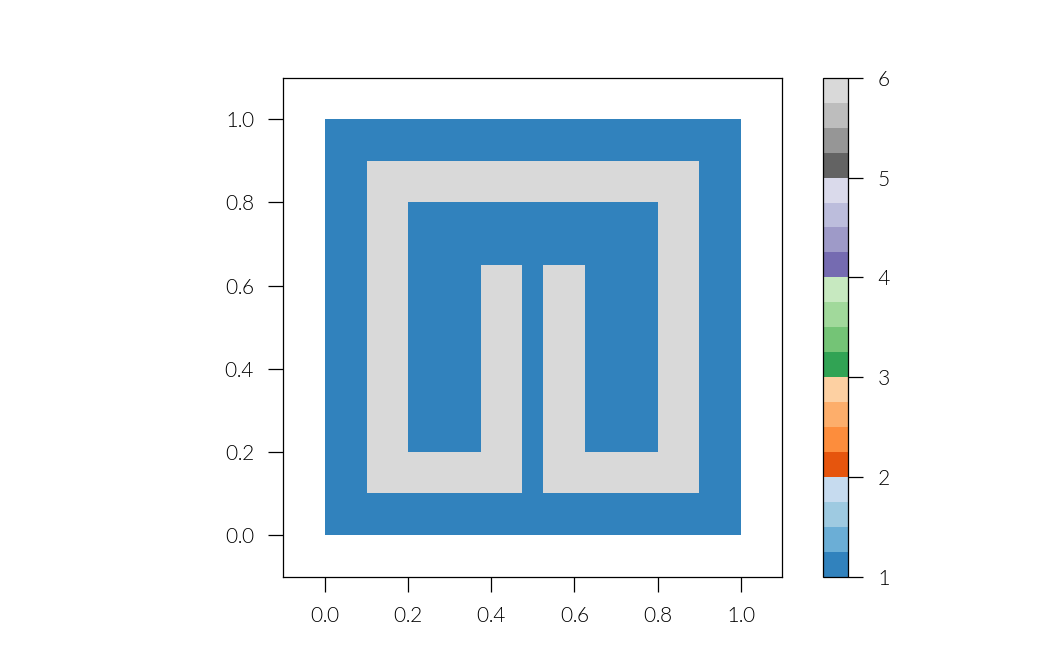
A split ring resonator
t = 0.1
l_out = 0.8
l_arm = 0.45
gap = 0.05

s_out = (1 - l_out) / 2
s_in = s_out + t
l_in = l_out - 2 * t

sq_out = sg.Polygon(
    [
        (s_out, s_out),
        (s_out + l_out, s_out),
        (s_out + l_out, s_out + l_out),
        (s_out, s_out + l_out),
    ]
)

sq_in = sg.Polygon(
    [
        (s_in, s_in),
        (s_in + l_in, s_in),
        (s_in + l_in, s_in + l_in),
        (s_in, s_in + l_in),
    ]
)
ring = sq_out.difference(sq_in)

g = sg.Polygon(
    [
        (0.5 - gap / 2, s_out),
        (0.5 + gap / 2, s_out),
        (0.5 + gap / 2, s_out + t),
        (0.5 - gap / 2, s_out + t),
    ]
)
srr = ring.difference(g)


a = 0.5 - gap / 2
b = s_out + t
arm_left = sg.Polygon(
    [
        (a - t, b),
        (a - t, b + l_arm),
        (a, b + l_arm),
        (a, b),
    ]
)
a = 0.5 + gap / 2
arm_right = sg.Polygon(
    [
        (a, b),
        (a, b + l_arm),
        (a + t, b + l_arm),
        (a + t, b),
    ]
)

srr = srr.union(arm_left).union(arm_right)
mask = lattice.geometry_mask(srr)
epsilon[mask] = 6

layer = lattice.Layer(epsilon=epsilon)
plt.figure()
ims = layer.plot()
plt.colorbar(ims[0])
plt.show()
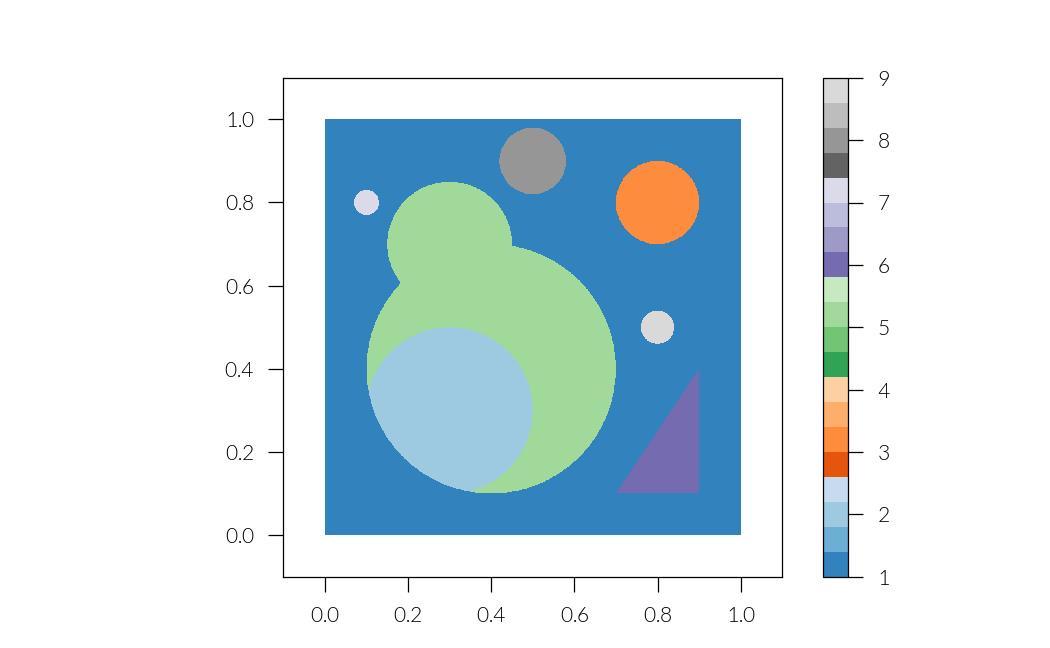
Various patterns
epsilon = lattice.ones()

circle = sg.Point(0.4, 0.4).buffer(0.3)
mask = lattice.geometry_mask(circle)

epsilon[mask] = 2
circle1 = sg.Point(0.8, 0.8).buffer(0.1)
mask1 = lattice.geometry_mask(circle1)
epsilon[mask1] = 3


circle3 = sg.Point(0.3, 0.3).buffer(0.2)
diff = circle.difference(circle3)
mask2 = lattice.geometry_mask(diff)
epsilon[mask2] = 4


circle4 = sg.Point(0.3, 0.7).buffer(0.15)
union = diff.union(circle4)
mask3 = lattice.geometry_mask(union)
epsilon[mask3] = 5

polygon = sg.Polygon([(0.7, 0.1), (0.9, 0.1), (0.9, 0.4)])
mask4 = lattice.geometry_mask(polygon)
epsilon[mask4] = 6

centers = [(0.1, 0.8), (0.5, 0.9), (0.8, 0.5)]
radii = [0.03, 0.08, 0.04]

for i, (c, r) in enumerate(zip(centers, radii)):
    circle = sg.Point(c).buffer(r)
    mask = lattice.geometry_mask(circle)
    epsilon[mask] = 7 + i


layer = lattice.Layer(epsilon=epsilon)
plt.figure()
ims = layer.plot()
plt.colorbar(ims[0])
plt.show()
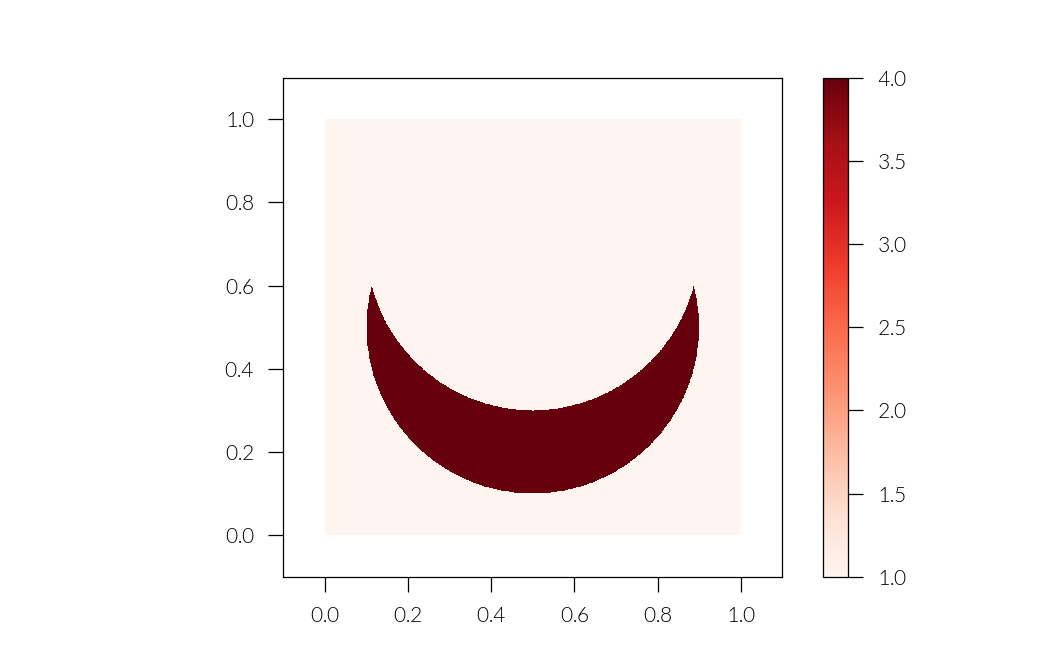
A crescent using built in nannos geometry and boolean logic
epsilon = lattice.ones()

circle0 = lattice.circle(center=(0.5, 0.7), radius=0.4)
circle1 = lattice.circle(center=(0.5, 0.5), radius=0.4)
diff = (circle0 ^ circle1) & circle1
epsilon[diff] = 4


layer = lattice.Layer(epsilon=epsilon)
plt.figure()
ims = layer.plot(cmap="Reds")
plt.colorbar(ims[0])
plt.show()
Read an image file
import urllib

from PIL import Image

url = "https://gitlab.com/nannos/nannos/-/raw/master/doc/_assets/nannos.png?ref_type=heads"
im = np.array(Image.open(urllib.request.urlopen(url)))
# im = plt.imread("../doc/_assets/nannos.png")
im = np.rot90(im, axes=(1, 0))

s = np.shape(im)[:2]

N = np.max(s)
M = int(0.2 * N)
N += M
im_bin = im[:, :, -1]
im_bin[im_bin < 0.5] = 0
im_bin[im_bin >= 0.5] = 1
im_bin = np.array(im_bin, dtype=bool)
im_pat = np.zeros((N, N), dtype=bool)
n0 = M // 2
im_pat[n0 : n0 + s[0], n0 : n0 + s[1]] = im_bin
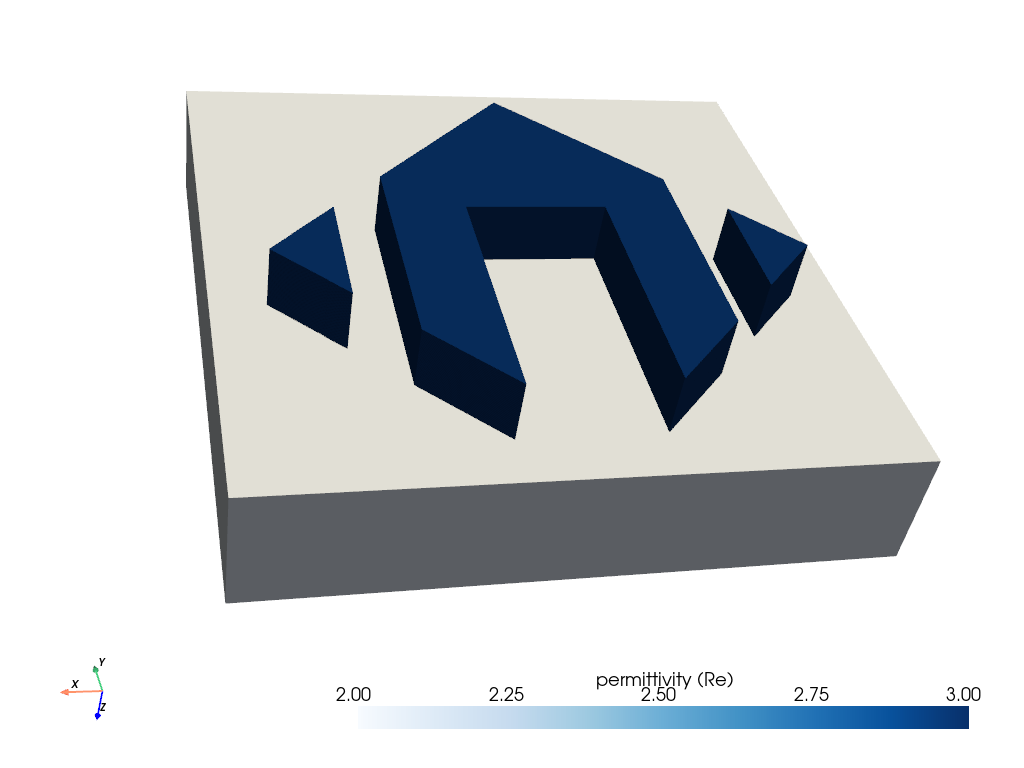
Define a simulation
lattice = nn.Lattice([[1.0, 0], [0, 1.0]], discretization=N)
sup = lattice.Layer("Superstrate", epsilon=1)
sub = lattice.Layer("Substrate", epsilon=2, thickness=0.2)
epsilon = lattice.ones()
epsilon[im_pat] = 3
ms = lattice.Layer("Metasurface", thickness=0.1, epsilon=epsilon)
pw = nn.PlaneWave(wavelength=1.2, angles=(0, 0, 0))
sim = nn.Simulation([sup, ms, sub], pw, nh=100)
R, T = sim.diffraction_efficiencies()
Plot unit cell
p = sim.plot_structure(cmap="Blues")
cpos = [
    (1.1192477879430005, -1.2748586620193856, -0.9994028480242046),
    (0.5184051413665429, 0.39573269350113394, 0.47559144020172595),
    (-0.03201639930679419, 0.6550248171539488, -0.7549287642472394),
]
p.show(cpos=cpos)
/builds/nannos/nannos.gitlab.io/nannos/nannos/plot.py:170: PyVistaDeprecationWarning: The default value of `inplace` for the filter `UnstructuredGrid.transform` will change in the future. Previously it defaulted to `True`, but will change to `False`. Explicitly set `inplace` to `True` or `False` to silence this warning.
  threshed = threshed.transform(transform_matrix)
/builds/nannos/nannos.gitlab.io/nannos/nannos/plot.py:137: PyVistaFutureWarning: The default value of `algorithm` for the filter
`ImageData.extract_surface` will change in the future. It currently defaults to
`'dataset_surface'`, but will change to `None`. Explicitly set the `algorithm` keyword to
silence this warning.
  mesh = grid.extract_surface()
/builds/nannos/nannos.gitlab.io/nannos/nannos/plot.py:138: PyVistaDeprecationWarning: The default value of `inplace` for the filter `PolyData.transform` will change in the future. Previously it defaulted to `True`, but will change to `False`. Explicitly set `inplace` to `True` or `False` to silence this warning.
  mesh = mesh.transform(transform_matrix)
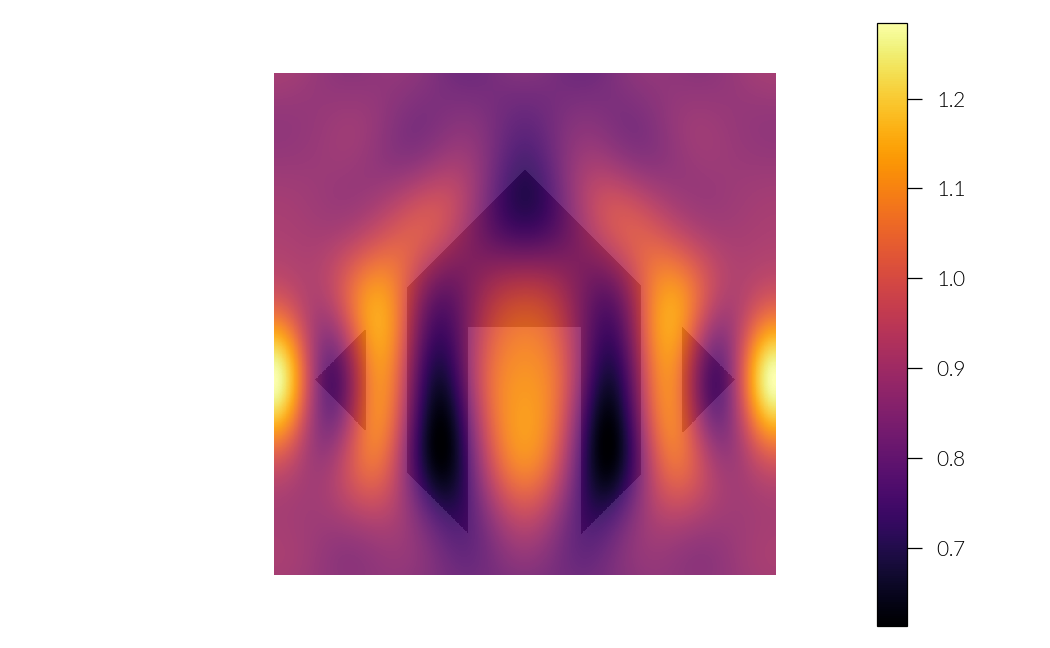
Get and plot the electric field
E = sim.get_field_grid("Metasurface", field="E", component="all")
Enorm2 = np.sum(np.abs(E) ** 2, axis=0) ** 0.5
plt.figure()
plt.pcolormesh(*lattice.grid, Enorm2[:, :, 0], cmap="inferno")
plt.colorbar()
ms.plot(alpha=0.1, cmap="Greys")
plt.axis("off")
plt.tight_layout()
plt.show()
Total running time of the script: (0 minutes 27.828 seconds)
Estimated memory usage: 1060 MB