
Note
Go to the end to download the full example code or to run this example in your browser via Binder.
Plotting layers#
Vizualizing a layer pattern in 2D with matplotlib.
import matplotlib.pyplot as plt

import nannos as nn
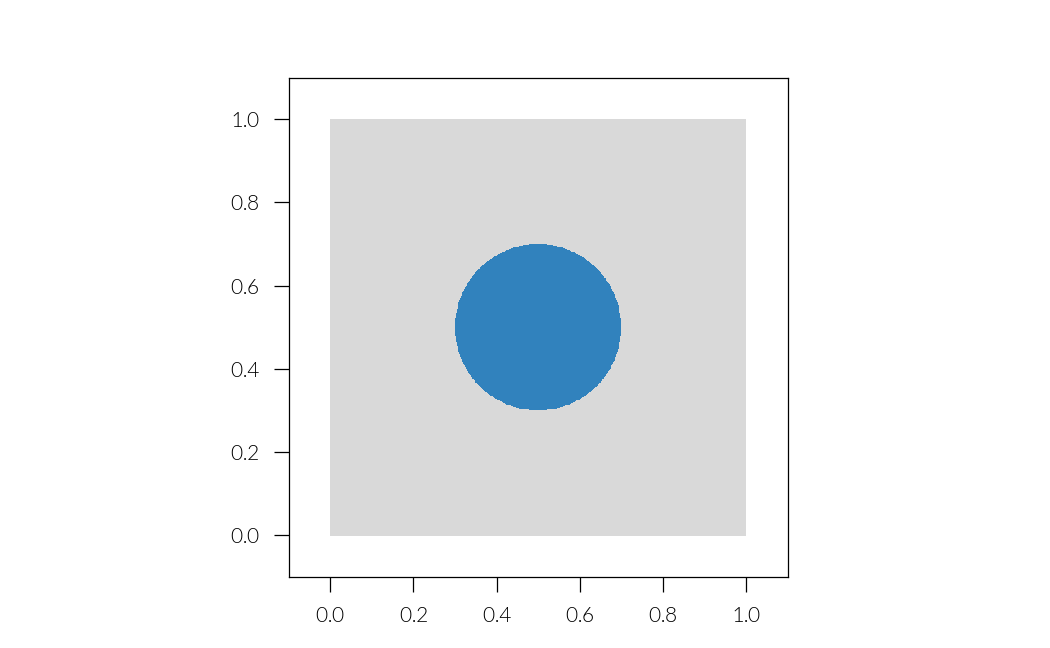
Let’s define our lattice:
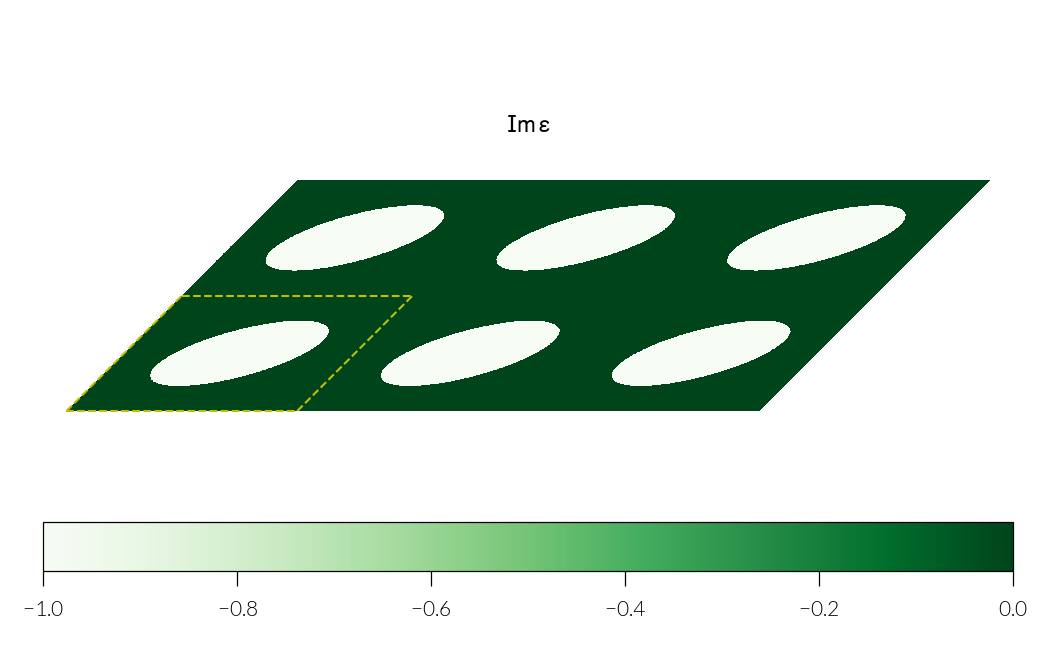
Another lattice with non orthogonal basis vectors:
lat = nn.Lattice(basis_vectors=[[1, 0], [0.5, 0.5]], discretization=2**9)
epsilon = lat.ones()
scat = lat.ellipse(center=(0.75, 0.25), radii=(0.4, 0.1), rotate=15)
epsilon[scat] = 3 - 1j

lay = lat.Layer(name="grating", thickness=1.3, epsilon=epsilon)
ims = lay.plot(nper=(3, 2), show_cell=True, cmap="Greens", comp="im", cellstyle="y--")
plt.axis("off")
plt.colorbar(ims[0], orientation="horizontal")
plt.title(r"${\rm Im}\,\varepsilon$")
plt.tight_layout()
plt.show()
Total running time of the script: (0 minutes 9.267 seconds)
Estimated memory usage: 642 MB